User Manual
Step 1: Logging In
To access the dashboard:
- Navigate to the login page.
- Enter your email and password.
- Click the Sign In button to access your personalized analytics dashboard.
Step 2: Dashboard Overview
Once logged in, you land on the Dashboard page.
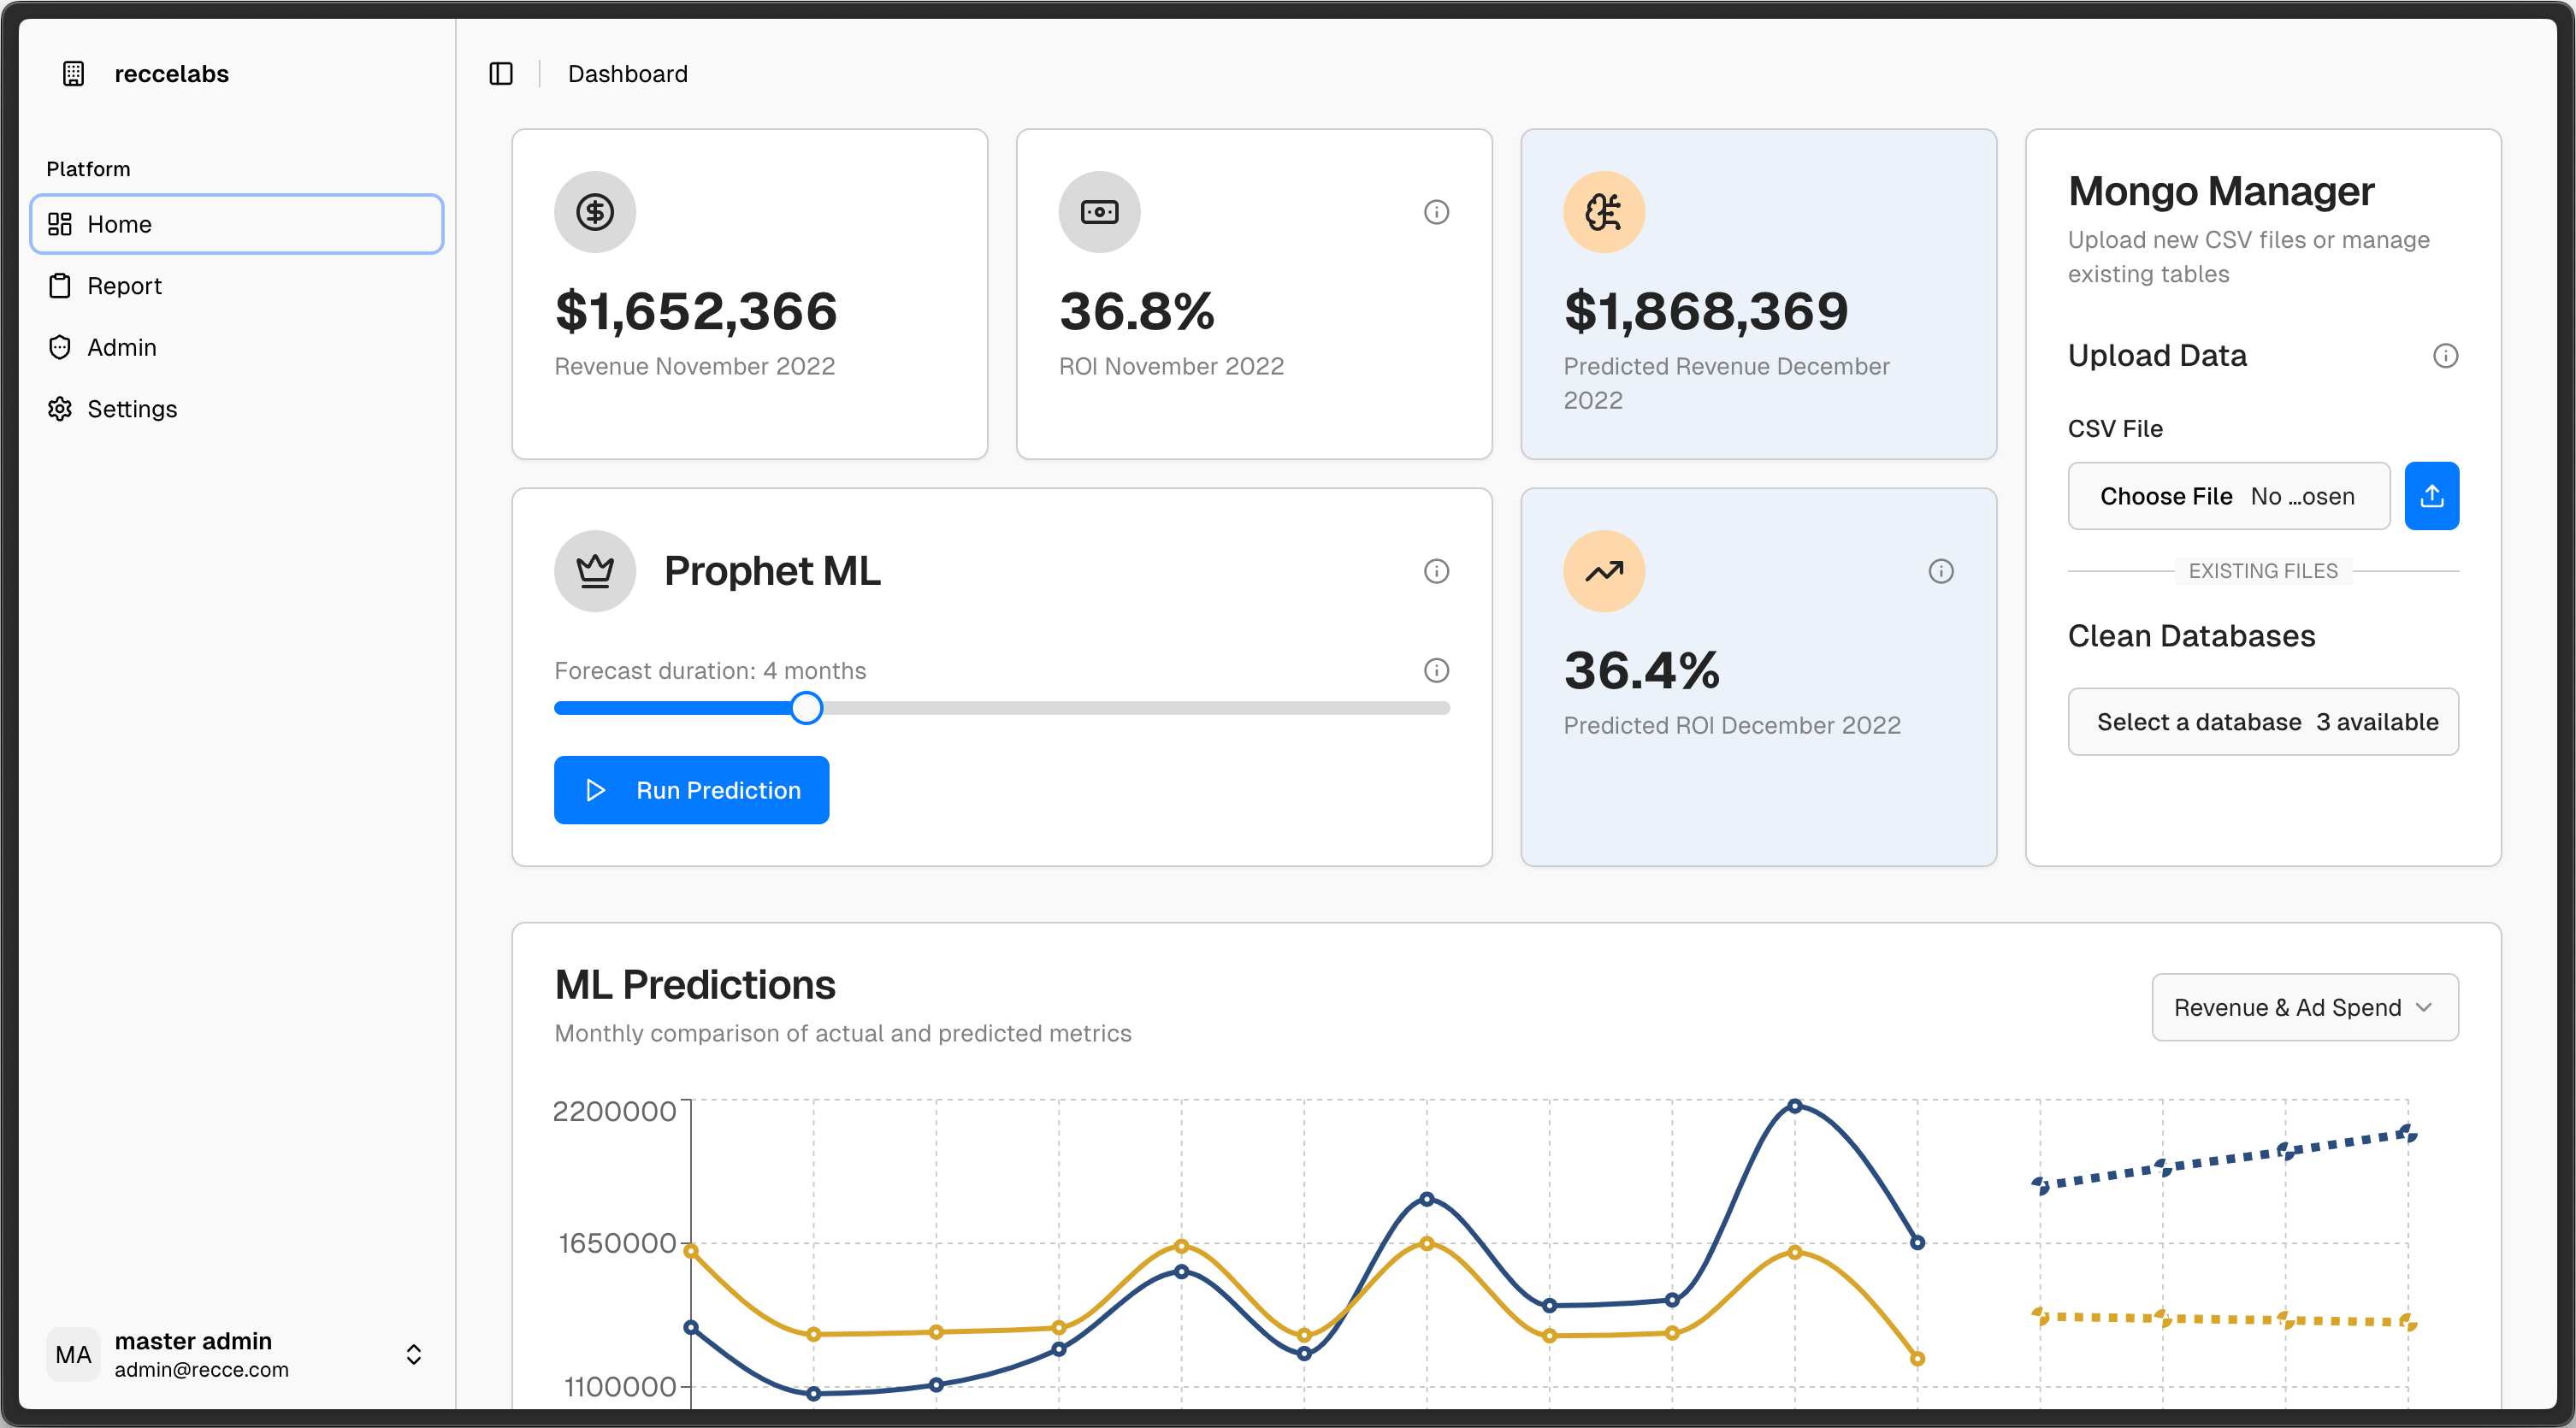
Key Metrics Panel
At the top of the dashboard, you can view:
- Current Revenue
- ROI
- Predicted Revenue (using AI)
- Predicted ROI
Mongo Manager (Data Upload)
If no data is available:
- Go to the Mongo Manager section on the right.
- Click Choose File to upload a CSV file.
- Select the database to import data into or clean existing datasets.
Running Predictions (Prophet ML)
- Use the slider to select your forecast duration (e.g., 4 months).
- Click Run Prediction to generate machine learning-based forecasts.
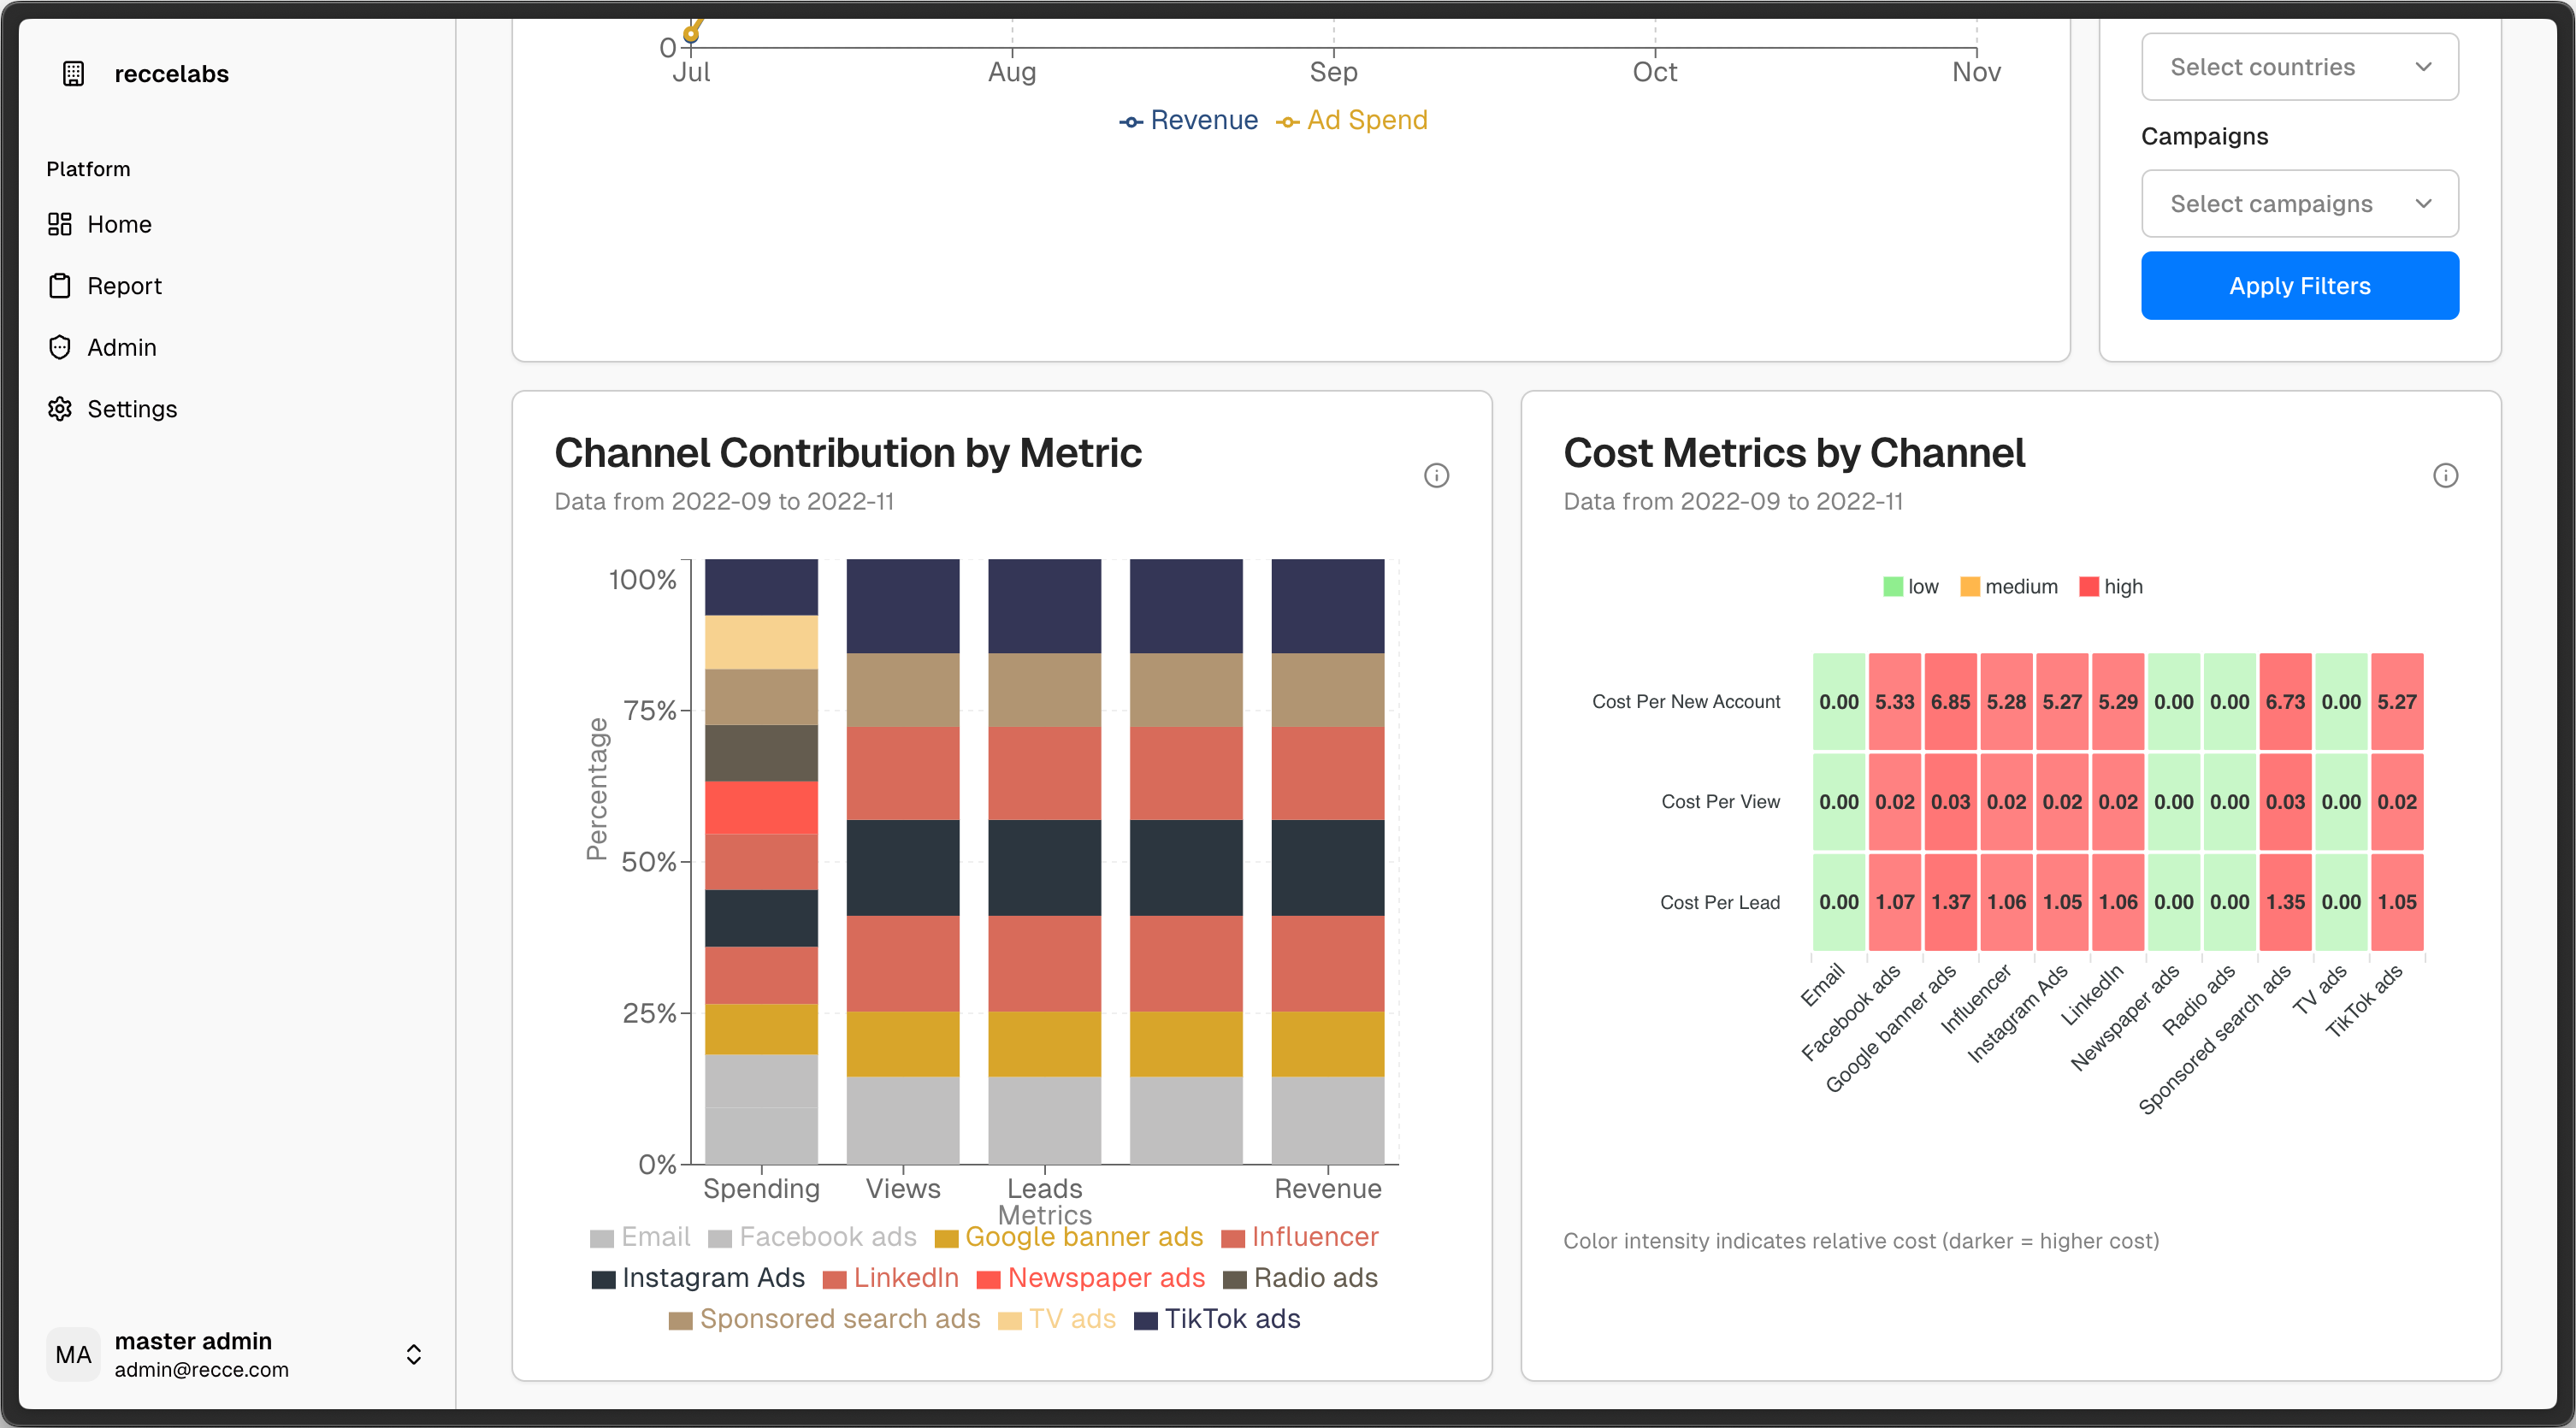
Visual Insights
ML Predictions
- View actual vs predicted trends for:
- Revenue
- Ad Spend
Filter Charts
- Apply filters by date, age group, channel, country, or campaign to customize your view.
Contribution by Channel
- Breakdown of channel performance by spending, views, leads, and revenue.
Cost Metrics
- Heatmap showing cost per acquisition across channels with color-coded intensity (low, medium, high).
Step 3: Report Generation (Report Tab)
Navigate to the Report tab to access the LLM-powered Report Generator.
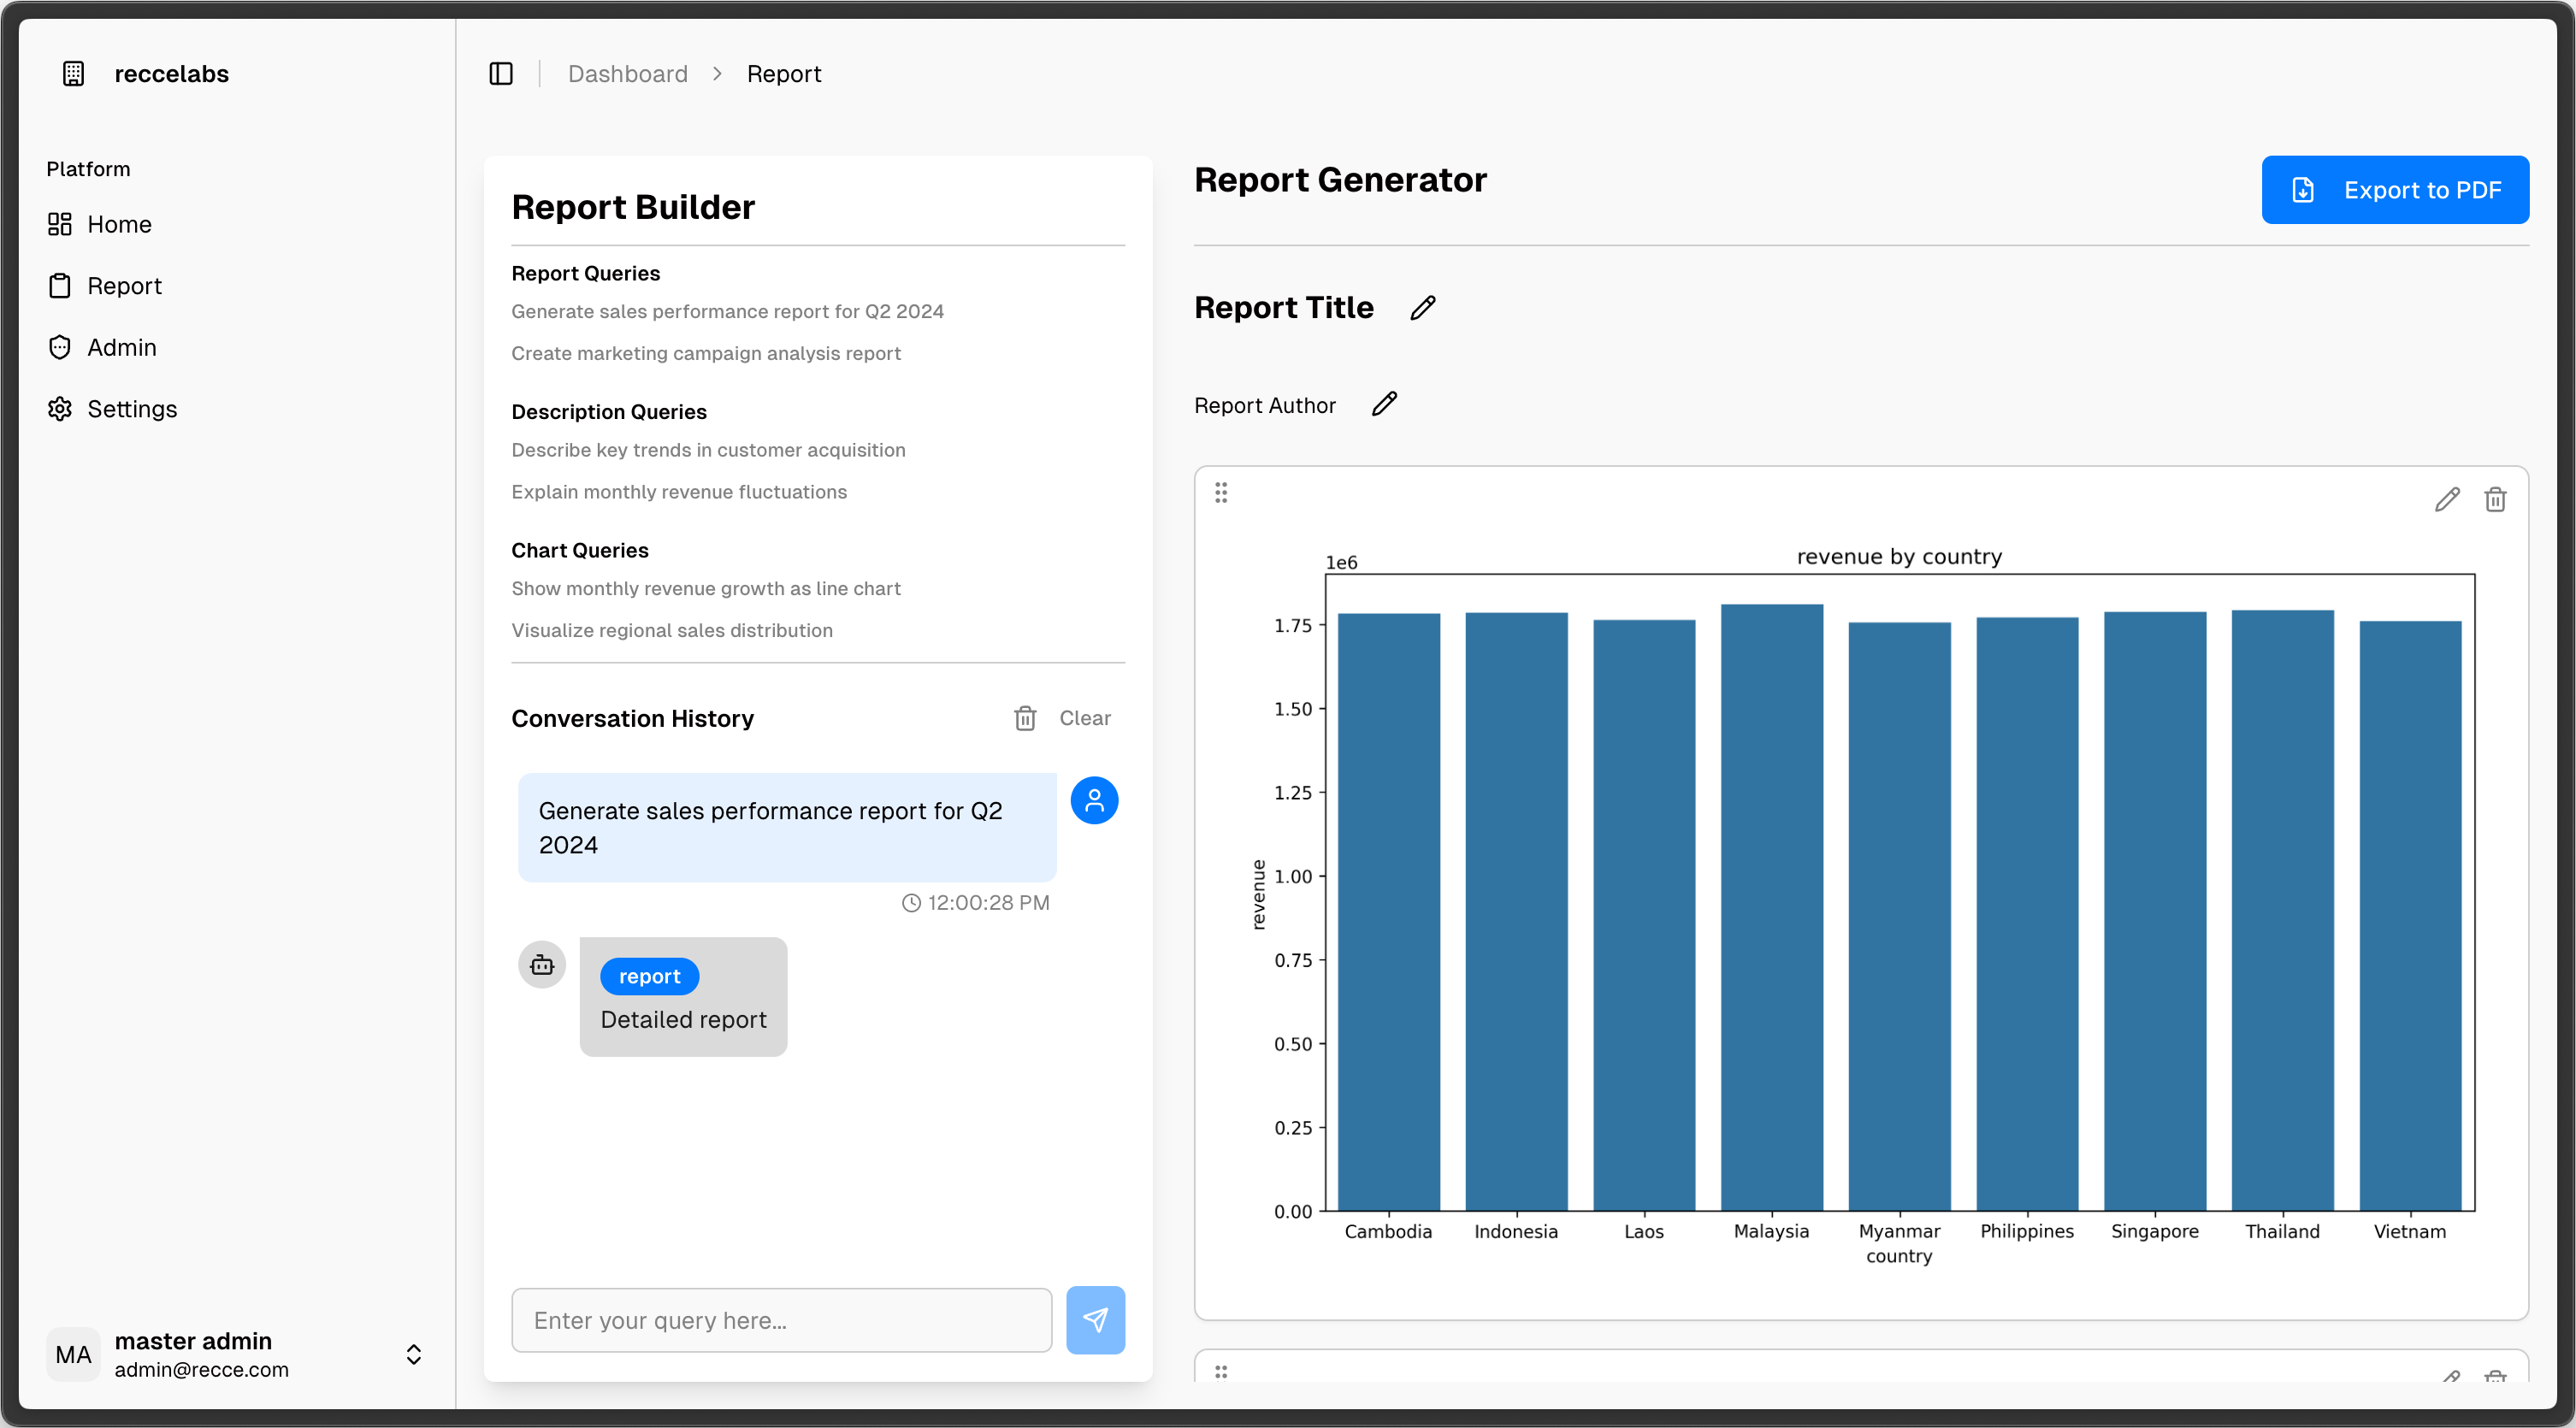
Report Builder Features:
- Use natural language queries to:
- Generate sales or marketing campaign reports.
- Describe customer acquisition trends.
- Explain fluctuations in revenue.
- Request visualizations (e.g., charts of regional sales or monthly revenue growth).
Customize Your Report
- Set a report title and author name.
- Add a custom description.
- Review conversation history of previous queries.
- Export the report directly to PDF.
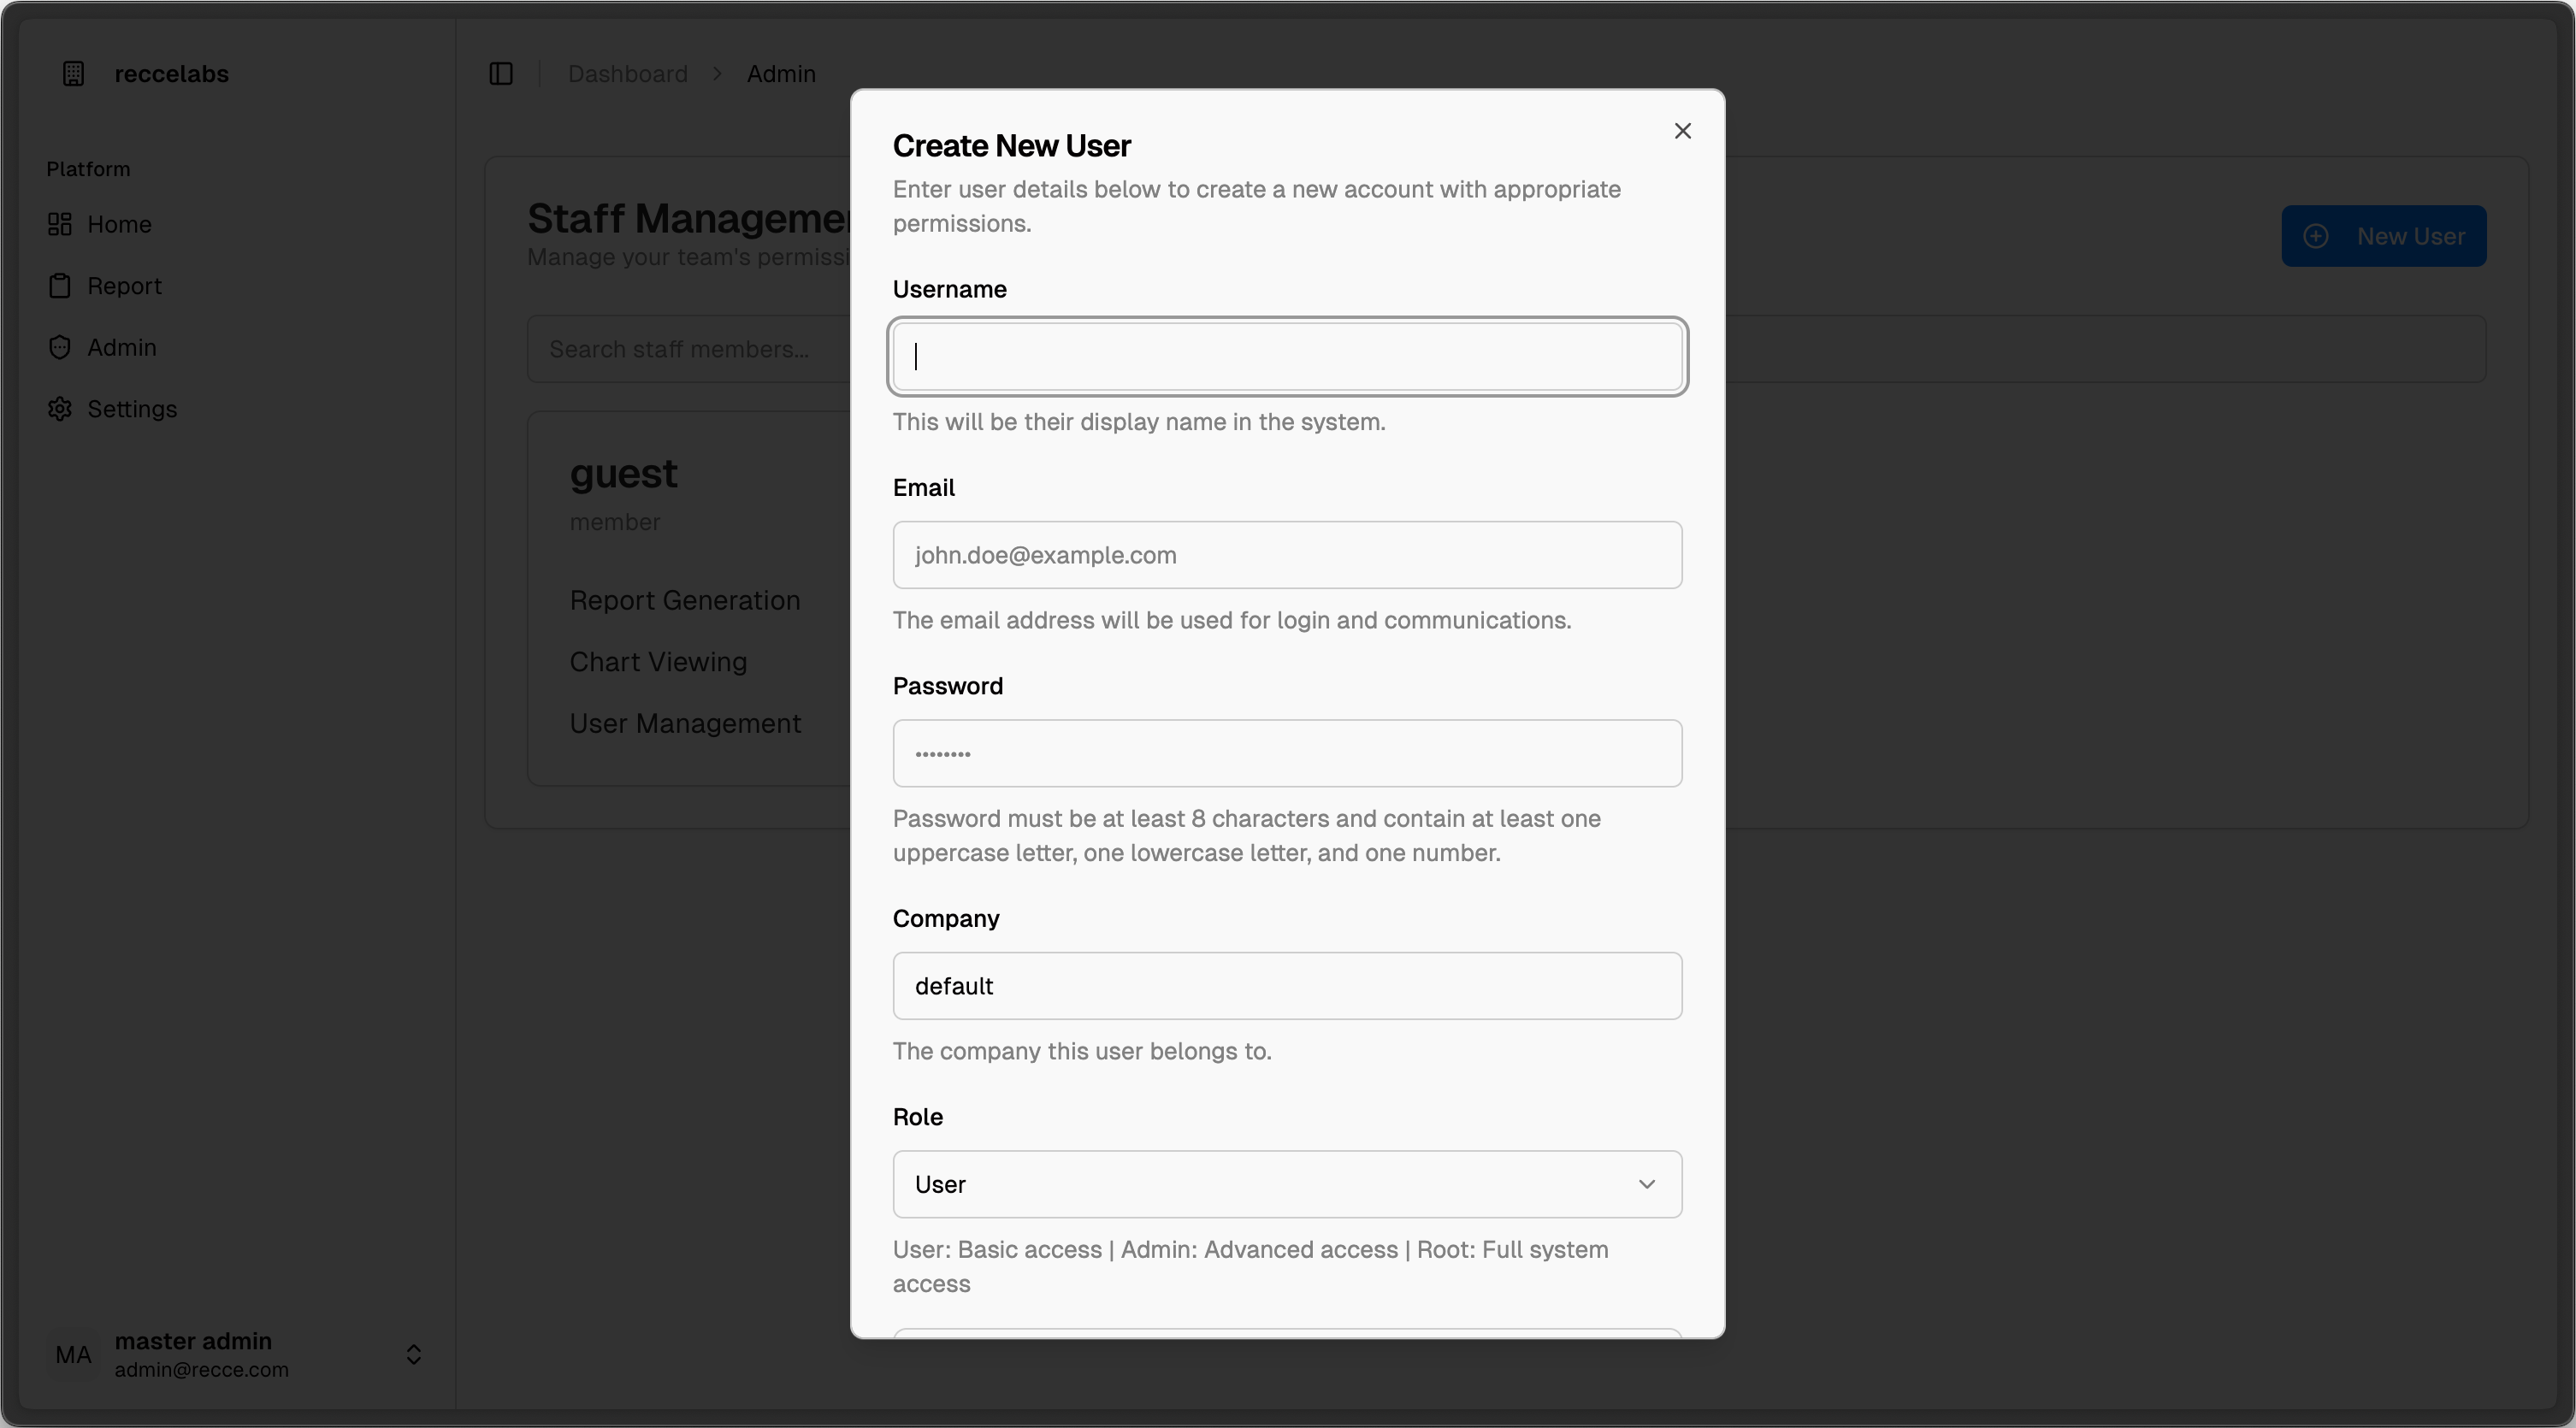
Step 4: User Management (Admin Tab)
In the Admin tab, manage team access and permissions.
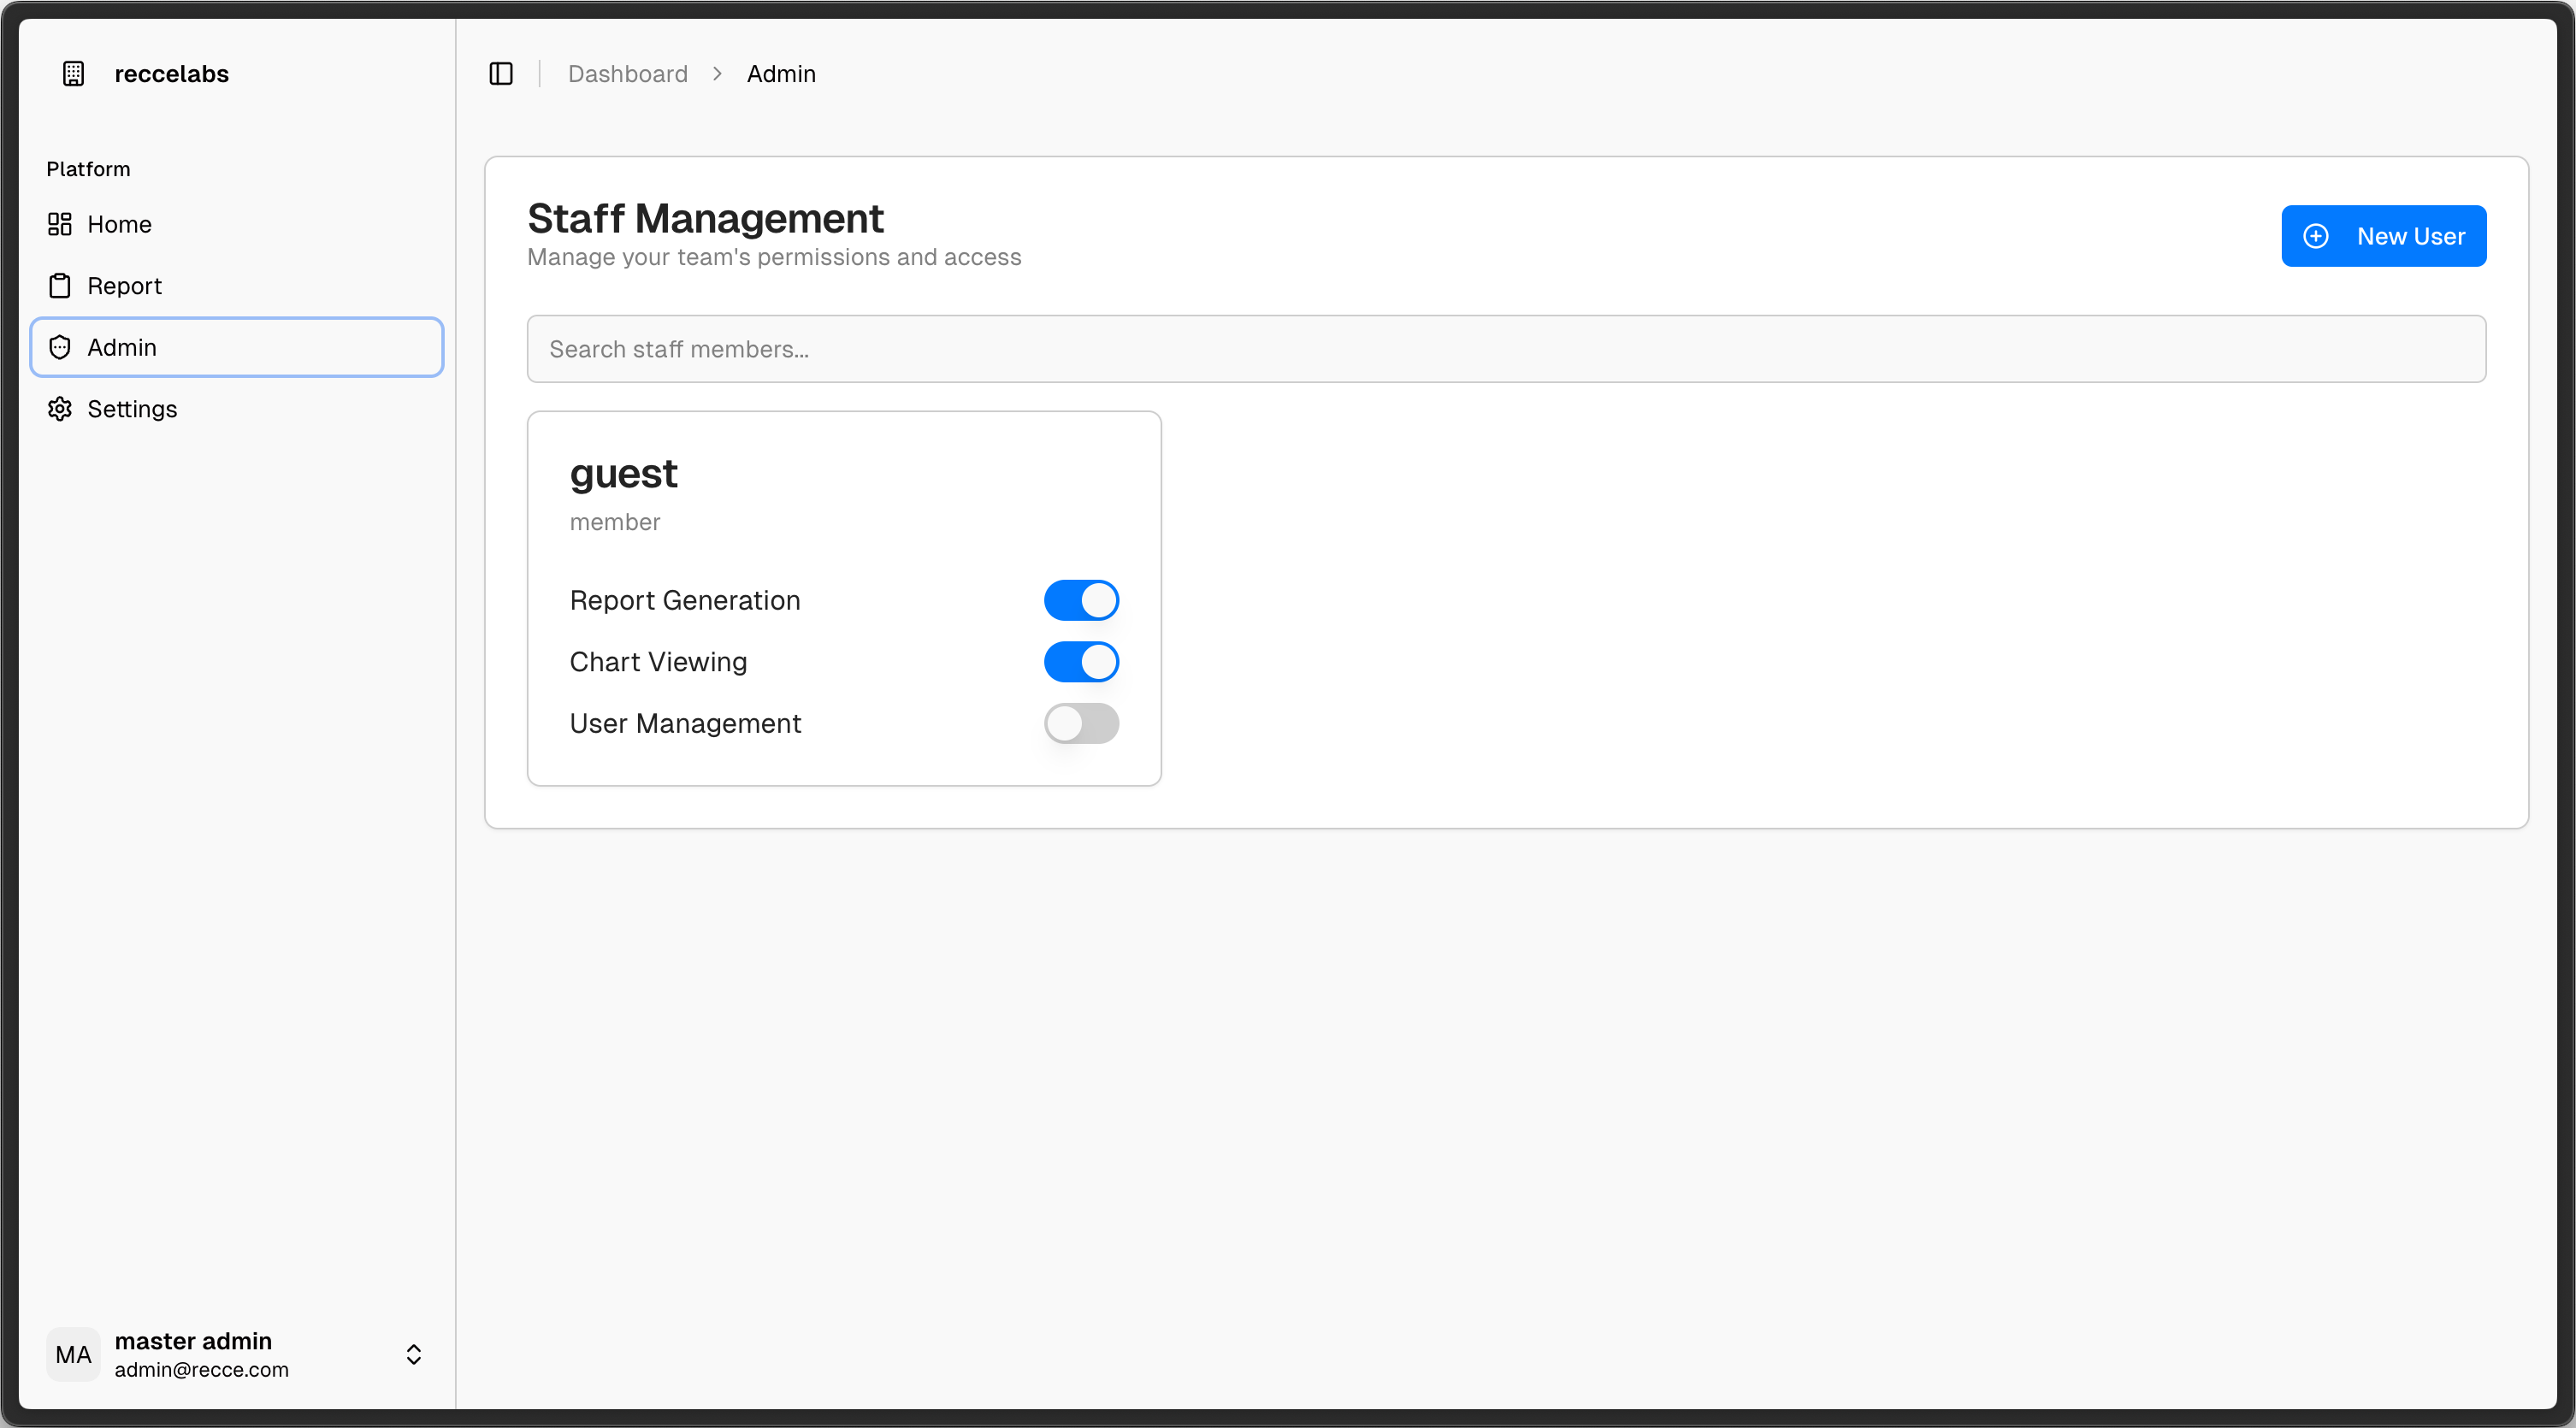
Permissions Include:
- Report Generation
- Chart Viewing
- User Management
To manage a user:
- Use the toggle switches to enable or disable permissions.
- Click New User to add a new team member.
Settings
Use the Settings tab to configure account or platform-level preferences.
Account Info
Your account info (name and email) is shown in the lower-left sidebar for reference.